

The Daily Meaning
Take your mornings to the next level with a daily dose of perspective and encouragement to start your day off right. Sign-up for a free, short-form blog delivered to your inbox each morning, 7 days per week. Some days we talk about money, but usually not. We believe you’ll take away something valuable to help you on your journey. Sign up to join the hundreds of people who read Travis’s blog each morning.
Archive
- April 2025
- March 2025
- February 2025
- January 2025
- December 2024
- November 2024
- October 2024
- September 2024
- August 2024
- July 2024
- June 2024
- May 2024
- April 2024
- March 2024
- February 2024
- January 2024
- December 2023
- November 2023
- October 2023
- September 2023
- August 2023
- July 2023
- June 2023
- May 2023
- April 2023
- March 2023
- February 2023
- January 2023
- December 2022
- November 2022
- August 2021
- November 2020
- July 2020
- June 2020
- April 2020
- March 2020
- February 2020
- October 2019
- September 2019
The Deceit of Cultural Narratives
My friend is the victim of what many of us fall prey to. We're sucked into cultural narratives that feed us enough half-truths until it becomes THE truth.
A friend recently reached out to ask a few financial questions. During the conversation, he made a comment that stopped me in my tracks: "It's surprising that you're such a big advocate for the stock market when it's doing so poorly." I didn't quite understand where he was going with this thought, so I asked him to explain. He shared that the stock market has been beaten up badly, and it's "only getting worse." He went on to draw into question the practicality of investing in the stock market, and stressed the notion of "too much risk."
While it's true the stock market dropped by approximately 20% in 2022 (which I would indeed classify as "beaten up"), he doesn't see the whole picture. It's a truth, but a half-truth. Er, a quarter-truth. Please allow me to fill in a few gaps:
In the first 11 months of 2023, the stock market (S&P 500) is up approximately 19% (not including dividends).
Over the past five years (including the 20% fall in 2022 and a 32% tanking in early 2020), the stock market has increased by more than 11% per year.
The stock market only needs to increase by 4.3% from today's value to hit an all-time 153-year high.
Over those 153 years, the market has increased by an average of just over 9% (including the reinvestment of dividends). The average is 11% per year for the past 40 years.
If all that isn't crazy enough, here's one more fun fact that may blow your mind. The WORST (yes, worst!) the stock market has done over a 30-year period is go up by 4.4x. Crazy, eh? The worst possible outcome during any 30-year window in US stock market history is quadrupling your money (plus a little more). Considering you can't even legally touch your retirement funds (without penalties/taxes) until age 59.5, if you're under the age of 30, you have at least 30 years before you'll even think about withdrawing those funds anyway. Context matters.
Ok, investment rant over. Here's the bigger takeaway. My friend is the victim of what many of us fall prey to. We're sucked into cultural narratives that feed us enough half-truths until it becomes THE truth. Investing is a big one, but far from the only one. Here are a few others that I frequently see:
It's impossible to attend college without student loans.
Buying a house is always a smart financial decision.
You need to use a credit card.
Groceries must cost your family $1,000+ per month.
We need to seek out the job with the highest possible income.
Having a car payment is inevitable.
____________ (insert yours here).
All of these are cultural narratives woven into the fabric of our society. Also, they are deceitful at best, and destructive at worst. If we just believe the narrative at face value, we concede it is our reality. Then, we casually float downstream toward an impaired reality.
Always question the narrative. Challenge the narrative. Seek the truth.
Inquiring Minds Want to Know
Through the lens of these numbers, the results submitted to me by readers look really sad. As a reminder, in the illustration I ran the other day, a 2% difference resulted in a $1.7M worse result for the family in the example. Based on our reader's numbers, we're talking about 3%, 4%, 5%, and even 6% difference between what they are getting and what the market is getting. This can be the make or break between having enough down the road....or not. This discrepancy gets magnified the younger the investor is.
A few days ago, I wrote about how most of us believe our investments are doing well, but that may not always be true. I used the example of a family who may unknowingly end up with $1.7M LESS. We don't know what we don't know.
In the last few days, I received dozens of messages from people asking what's actually good. Most of them perceive their investments as "doing good," but doubt started to creep in after reading that post. To figure it out, they dug into their investments in one of two ways: 1) look at what the trailing annual returns were for the last 5, 10, 15, or 20 years (which you can often find on your statements.....especially if you've been investing for a while), or 2) look at each fund in their portfolio to see what that specific fund has done over those periods (and use the proportions to run some averages).
Results were all across the board. Examples include 6% per year, 7% per year, and even 8% per year (and everywhere in between). There was even a 9%ish number in there! Most people felt these numbers were solid. But the question attached to each inquiry was what to compare it to. Was it actually good? Were these numbers up to par? Were they unknowingly underperforming?
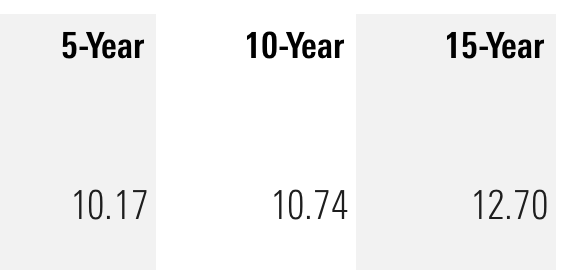
Here are a few numbers to consider. The following is the performance of a popular total stock market index fund containing approximately 3,800 U.S. companies of all shapes and sizes, wrapped up in one inexpensive and accessible investment. We can view this as the barometer for the entirety of the U.S. stock market. These numbers represent an average annual return over the designated period:
Last 5 years: 10.2% per year
Last 10 years: 10.7% per year
Last 15 years: 12.7% per year
Through the lens of these numbers, the results submitted to me by readers look really sad. As a reminder, in the illustration I ran the other day, a 2% difference resulted in a $1.7M worse result for the family in the example. Based on our reader's numbers, we're talking about 3%, 4%, 5%, and even 6% difference between what they are getting and what the market is getting. This can be the make or break between having enough down the road....or not. This discrepancy gets magnified the younger the investor is.
Ouch! Here's the good news. What's in front of us is more important than what's behind us. Let's say we're 40 years old and have been investing for 15 years. Sure, it would have been nice to have better returns for the first 15 years. However, you still have 40+ years ahead of you......with a higher base to start with.
Let me end with this. Yes, it feels scary. Nobody wants to take risks. In the 153-year history of the U.S. stock market, there's never been a 15-year period where the market lost money Ever. The worst was +1.15% per year from 1929-1943. While past performance never dictates future results, that doesn't feel overly risky.
This post is a lot more about money than meaning, but it’s important we handle our finances with confidence. When we do, we worry a lot less and can focus on what’s really important….the meaning!
*This post does not constitute formal financial advice. It is meant to provide general insight without the full context of each person's financial situation.
Sometimes, "Pretty Good" Sucks
I recently had a conversation that I repeat multiple times per week. I was meeting with a friend, and the topic of investing came up. They mentioned they use a financial planner who does a "pretty good job." This comment always sets off my red flag and warning sirens. What is the definition of a pretty good job? How do we know our investments are performing well? Because they are going up? Because they are being watched? Because they are spread across a few dozen funds that sound like some sort of twisted alphabet soup? Because they are being managed by someone we know and trust?
I recently had a conversation that I repeat multiple times per week. I was meeting with a friend, and the topic of investing came up. They mentioned they use a financial planner who does a "pretty good job." This comment always sets off my red flag and warning sirens. What is the definition of a pretty good job? How do we know our investments are performing well? Because they are going up? Because they are being watched? Because they are spread across a few dozen funds that sound like some sort of twisted alphabet soup? Because they are being managed by someone we know and trust?
I asked them what company they use for their investments. In my head, all I could think was, "please don't say xyz, please don't say xyz, please don't say xyz." "We work with xyz." Nooooooo! That's the moment I knew they were in a tough spot. For what it's worth, xyz is a very prominent, highly respected, broadly welcomed financial advising company. Before I go on, please let me clarify that nothing this company does is inherently immoral, illegal, or ill-intentioned. Rather, they do things the old way. By "the old way," I mean the way things used to be done before they didn't need to be done that way anymore. In today's world, we have access to the very best funds in the world, at the tip of our fingers (er, screen), at little to no cost.
Knowing what company they are working with, I know the general lay of the land. They are most likely paying around 1.25% for management fees and have a portfolio that will, over a long period of time, perform at least 0.75% worse than the overall stock market. Therefore, this person is likely invested in a portfolio that will perpetually perform 2% less than the overall stock market. If the stock market performs at a long-term 9% (just below its historical average), this person may receive 7%. This doesn't seem like a meaningful difference, but let's look at the math:
Here are the assumptions:
Current age: 42
Ending age: 65
Current balance: $500,000
Annual contributions: $25,000
These are very simple, rough numbers for illustrative purposes.
At age 65, their current strategy would result in a balance of approximately $3,700,000. See, that's pretty good! That's a lot of money! Their person did a great job!
But wait, what about the other way? If this person were to simply invest in the overall market (readily accessible to each of us at practically no cost), they would have approximately $5,400,000 instead. That's a $1,700,000 difference!!! I don't know the definition of "pretty good," but in my book, ending up $1,700,000 worse off fails my smell test.
This isn't my friend's fault. After all, nobody teaches us this stuff! Here's the beautiful part, though. All it takes is one simple tweak. It seems too good to be true, but it's not.