
Inquiring Minds Want to Know
A few days ago, I wrote about how most of us believe our investments are doing well, but that may not always be true. I used the example of a family who may unknowingly end up with $1.7M LESS. We don't know what we don't know.
In the last few days, I received dozens of messages from people asking what's actually good. Most of them perceive their investments as "doing good," but doubt started to creep in after reading that post. To figure it out, they dug into their investments in one of two ways: 1) look at what the trailing annual returns were for the last 5, 10, 15, or 20 years (which you can often find on your statements.....especially if you've been investing for a while), or 2) look at each fund in their portfolio to see what that specific fund has done over those periods (and use the proportions to run some averages).
Results were all across the board. Examples include 6% per year, 7% per year, and even 8% per year (and everywhere in between). There was even a 9%ish number in there! Most people felt these numbers were solid. But the question attached to each inquiry was what to compare it to. Was it actually good? Were these numbers up to par? Were they unknowingly underperforming?
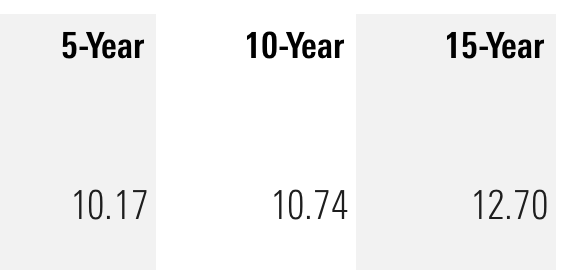
Here are a few numbers to consider. The following is the performance of a popular total stock market index fund containing approximately 3,800 U.S. companies of all shapes and sizes, wrapped up in one inexpensive and accessible investment. We can view this as the barometer for the entirety of the U.S. stock market. These numbers represent an average annual return over the designated period:
Last 5 years: 10.2% per year
Last 10 years: 10.7% per year
Last 15 years: 12.7% per year
Through the lens of these numbers, the results submitted to me by readers look really sad. As a reminder, in the illustration I ran the other day, a 2% difference resulted in a $1.7M worse result for the family in the example. Based on our reader's numbers, we're talking about 3%, 4%, 5%, and even 6% difference between what they are getting and what the market is getting. This can be the make or break between having enough down the road....or not. This discrepancy gets magnified the younger the investor is.
Ouch! Here's the good news. What's in front of us is more important than what's behind us. Let's say we're 40 years old and have been investing for 15 years. Sure, it would have been nice to have better returns for the first 15 years. However, you still have 40+ years ahead of you......with a higher base to start with.
Let me end with this. Yes, it feels scary. Nobody wants to take risks. In the 153-year history of the U.S. stock market, there's never been a 15-year period where the market lost money Ever. The worst was +1.15% per year from 1929-1943. While past performance never dictates future results, that doesn't feel overly risky.
This post is a lot more about money than meaning, but it’s important we handle our finances with confidence. When we do, we worry a lot less and can focus on what’s really important….the meaning!
*This post does not constitute formal financial advice. It is meant to provide general insight without the full context of each person's financial situation.